


What is an audiogram?
An audiogram is a chart/graph used to plot the results of a person’s hearing test. What does an audiogram look like? How is it created? How is it read? You can find answers to the most frequently asked questions as well as more information on hearing tests and audiometry below.

What does an audiogram look like?
The results of a hearing test are plotted on a chart called an audiogram.
The audiogram forms one part of your total hearing assessment and provides a useful piece to the jigsaw on your hearing ability. Your Boots audiologist will explain your results to you in terms of volume, pitch and speech sounds.
By interpreting your results your audiologist can understand the extent and nature of any loss measured and if any referable conditions exist.
How is an audiogram created?
During a hearing test sounds are presented at different pitches and volumes. A computer driven audiometer is used to generate the sounds and the audiologist controls which pitch of sound is presented at what intensity.
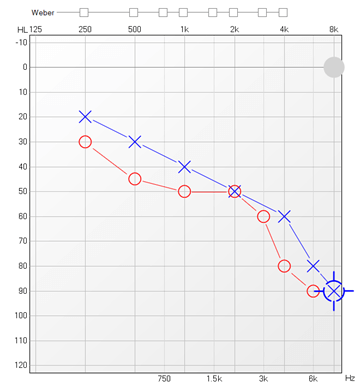
A person having their hearing tested responds by pushing a button when they hear a sound. The quietest level of sound heard at each pitch is then plotted on the audiogram using a red circle for right ear and a blue cross for left ear. The position of the symbols is compared to an agreed normal hearing level of 25dB across all pitches of sound. The further down the chart the results are plotted the louder the sound had to be made.
The audiologist measures;
Air conduction hearing – this measures the sound intensity heard through the outer, middle & inner ear
Bone conduction hearing - this is a via a vibrating pad behind the pinna and measures the sound intensity heard through the inner ear only (different symbols are used on the audiogram for the bone conduction results)
Hearing test evaluation: how is an audiogram read?
The pattern & position of the air and bone conduction results for each ear can be interpreted by the audiologist to explain the extent, nature and possible cause of any results that fall outside of the normal range.
The vertical axis of the audiogram chart is used to show the loudness or intensity of the signal presented. This is measured in decibel (hearing level ) dBHL. The axis starts at -10dBHL (very quiet) and increases in 5dBHL steps upto 120dBHL (very loud).
The frequency (tone/pitch) is read along the horizontal axis. The left of the axis starts at low pitched sounds and rises in pitch as you go across to the right.
The audiologist will interpret the results for each ear to determine the severity and nature of any loss that may be present. It is typical that a loss impacts on both ears symmetrically but often there can be asymmetry and varying levels. Your audiologist will compare the air and bone conduction results of each ear to explain if there is a symmetry and if the loss is predominantly;
• Sensori – neural
• Conductive
• Mixed
What are decibels?
Sound level is measured in decibels (dB) using the decibel scale. The decibel scale is a logarithmic scale in which the doubling of the sound pressure level corresponds to a level increase of 6 dB. Decibels are not fixed values like volts or meters. There are various dB scales depending upon the environment through which the sound travels. In audiometry we use a calibrated decibel hearing level scale (dBHL).
Here are some examples of different volumes, measured in decibels:
• 180 dB: a rocket launch
• 140 dB: a jet plane
• 120 dB: a rock band
• 110 dB: loud thunder
• 90 dB: city traffic
• 80 dB: a loud radio
• 60 dB: a conversation at normal volume
• 30 dB: whispering
• 0 dB: the quietest sound that can be heard by the human ear
What are frequencies?
Tone frequency is the number of vibrations in a sound wave per second. The unit of measurement is the Hertz (Hz). The higher the number, the higher the frequency. Vibrations between 20 and 20,000 Hertz are interpreted as sounds by the average person. The twittering of birds is one example of a high tone. Low tones include distant thunder or a tone on a bass guitar.
High-frequency hearing loss means that the affected person has problems starting with impairment in the higher frequencies only. These include sibilants (-s-, -f-, or –sh-) and consonants. Those affected find it difficult to hear tones with high frequencies and often mis-hear words. People with high frequency loss will often say female & children's voices are harder to hear or they miss specific high pitched ringing sounds.
Low frequency is less common but results in a loss of volume. Low pitched sounds are typically the vowels in speech. Your audiologist can overlay the speech sounds on top of your audiogram results so you can see which sounds in speech you may miss.